When you want to quantify the cost of transferring an amount of data through the internet you would need to measure at every hop of the packet and add up cost for routers, cables, tranmission towers etc.
Since this measurement data is not available a heuristic is used that estimates the cost of all this network equipment the data has to flow through based on the actual transferred amount of data in GB.
When you have the value already in GB you can just convert them with a constant factor to kWh.
As you might suggest this seemingly easy formula makes a lot of assumptions and uses a lot of averages.
Typically these approaches either follow a top down approach by looking at the electricity bill of a telecom provider and then the network transmission reporting to divide the two numbers.
Other approaches are to really trace the path of some sample packets and look at every piece of network equipment on the way and then on its power draw for the transmission only.
There are also other approaches but all have downsides and upsides. The number of 0.06 kWh / GB is already a mix with the idea to get the best out of all of these approaches.
The study linked in the source [1] down below also notes that through advances in efficiency the electric intesity drops by around a half every 2 years and suggests that an extrapolation for the coming years might be a valid assumption. This would bring the value in 2024 down to a ~0.002652 kWH / GB (0.06 / (2**(9/2)))
However this model is not without critique, as the real nature of network devices to date is that they consume 80% of their peak capacity already in idle mode. The rest is a proportional factor according to the usage of the possible bandwidth. Many models have been proposed to better attribute this reality on the real electricity cost for application that uses the network, however time-share or data-share models all have different downsides [2].
We deciced to use the linear approach of network transfer attribution to power consumption in our tools as it bests incentives the user to keep the network traffic to a minimum. No matter which current known calculation method is used it will be inaccurate still and none of the current methods can reliably incorporate the real costs of provisioning new hardware for bandwith increase back in time to the pool of applications that tipped the providers to increase the bandwith.
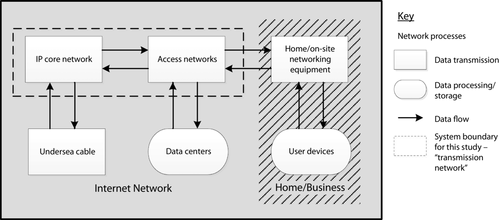
Included Network parts
The important point to note with this number is which parts of the network are included. In the picture on the right you see the included parts. Only the Access Network and the IP core network is included, which means the connection between datacenters and telecom providers.
Not included are the networking inside of the datacenters and also no end-user devices or their in-Home wifi. The calculation only goes to the curbside.
Also important: Only fixed line transmissions are included in this number. No mobile traffic, which is typically more energy intensive by at least the factor 2-3x.
Value in Gigabytes
If your value is in Megabytes the conversion factor has to be divived with 1.000 and will equate to 0.0000028125 MB / kWh
This conversion is probably the most often done and also the one with the most impact.
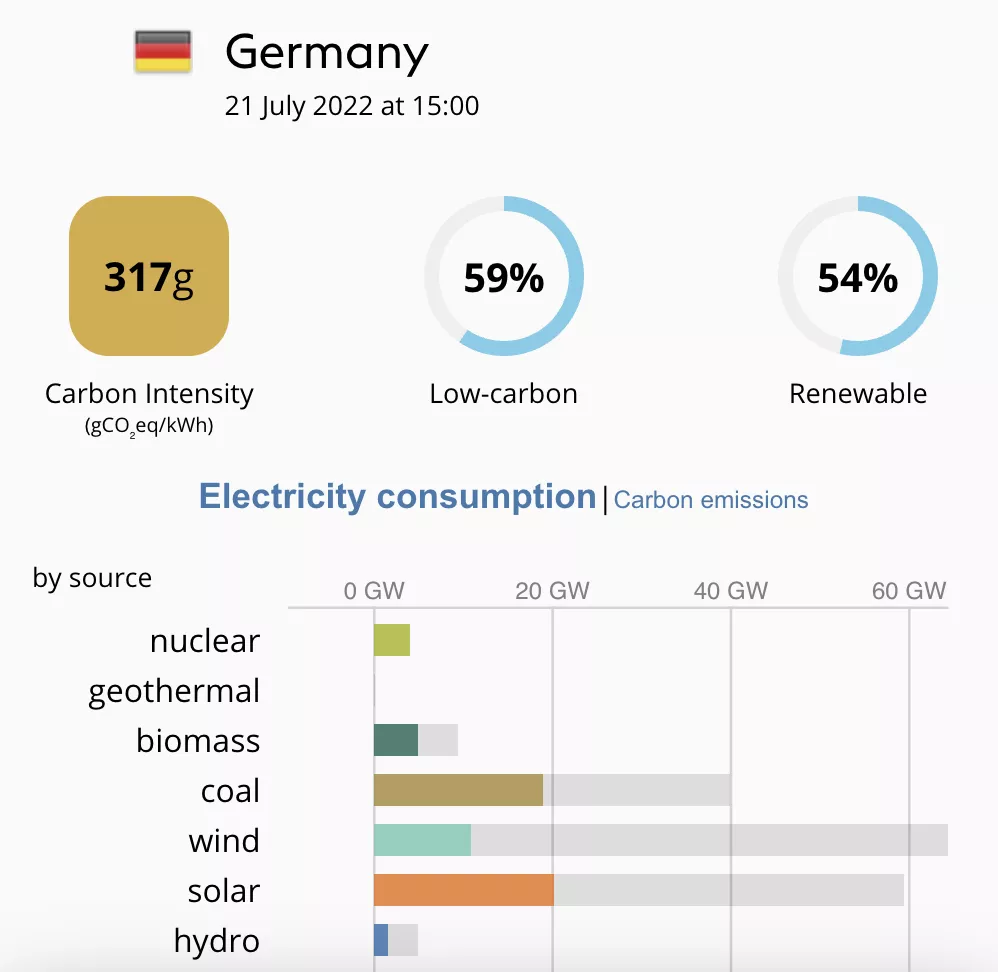
By most often done we mean that companies already get the current intensity of their grid and schedule workloads accordingly.
The current intensity of the grid can for instance be retrieved from Electricitymap.com. In our case in Germany the number is at the moment 317 gCO2e/kWh
Worldwide average grid carbon intensity
If your workload is distributed over multiple countries or you don't know at all where your workload is running, then the best way is to take the global average.
For 2022 this number is: 436 gCO2e/kWh (No numbers for 2023 have been released as of writing on 10.02.2024)
So if we were to plug in this number into a calculation starting with kWh we get directly to gCO2e, which means gramms of CO2 equivalent. Since not every checmical process generates pure CO2 they are all converted to the equivalent climate warming potential of CO2, which results in CO2e
Source: Ember Climate
Some energy budgeting tools or internal power meters (like Intel RAPL) give you *Joules* as an output value.
The actual SI-Unit value of Joules is Ws. So in order to get to kWh you have to first get to hours (60*60) and then get to *kilo*, which means to divide by a thousand
Joules zu kWh
And vice versa:
kWh to Joules
If you cannot measure the Watts directly (with an external powermeter, Intel RAPL, etc.) then you can always use datasheets or benchmarks and interpolate to get to your power value.
A naive approach to estimate the energy draw of a processor would be to use its Thermal Design Power (TDP).
This gives you a first impression in which order of magnitude your expected energy value is.
Example: My Intel i7-5557U has a TDP of 28 W
If I were to do a compute of 5 seconds I would expect an energy consumption of 140 Ws (28 W * 5 s), aka 140 J.
If you look at our CPU measurement of a full CPU load you will see that the measured value is only ~60 J.
So we can conclude that the TDP is a very rough estimate, and serves as a good upper bound. But it exaggerates the real energy by quite a bit.