
We finally got our DC measurement setup ready … sadly around one month later than expected.
If you wanna see first results go here:
If you wann get the details of our journey, why we are integrating it into our tool, some tech specs and the future outlook on when we have the AC measurement ready, then read on :)
Why?
Current energy measurement in software that works in a small time resolution is mostly done in with RAPL interfaces.
Typically either directly or through tools like Scaphandre.
If you want to have more direct DC power readings you can use the Marcher system from the Texas State University with their Green Code hosted service.
While this last option works generally fine especially with C code, we had some problem to get more complex PHP and Python code running. You can however apply for an SSH access to get more complex code working, we did not try though. Also the jQuery interface is partially broken and getting a detailed power consumption is not possible anymore.
Other folks like datacenter owners typically rely on AC measurements, which however do not give you a per-application granularity and are typically only delivered monthly or less (Google carbon footprint methodology).
What all these systems are lacking though is a direct comparison of how AC, DC and internal measurements differ in the output you are getting and the conclusions you can make.
This info we believe is on the one hand quite educational, but also allows you to create better machine learning models that allow to measure in the cloud, where neither DC, AC or RAPL interfaces are usually available. The final problem: Since the code was not really accessible no other reporters could be attached, like for instance network traffic.
A very interesting concept was the appraoch from Bob Adolf, which to our knowledge was never executed in full.
Many models in academia tried already to create linear models out of performance counters or OS level metrics, but these models are never really open sourced.
The best plug&play ready program out there probably the one from microsoft research. However the download has officially been pulled … why?
In all the other papers we read the exact coefficients unknown, exact hardware used not anymore available, load programs are not available, operating system versions used very outdated, CPU configurations unclear etc.
While all problems not generally unsolveable and we could have contacted the team behind the study.
However since none of the approaches was very current and active, none was really open-source with a community approach we opted for starting the process on our own.
Adventures in DC measurement
As said before we found the work from Bob Adolf most interesting. It was the first holistic approach to combine many energy measurement forms into one system and also use mostly off-the shelf hardware.
Our PC we wanted to use was a Fujitsu Esprimo P956. Reason being that this machine is officially required by the Blauer Engel for Software we have here in Germany, which is an eco label for Software.
In order to reproduce and falsify their (AC)-measurements this system was a needed and logical starting point.
We got the NI-USB 6009 and started building a custom ATX connector for it.
To our suprise all the ATX connectors we got from Amazon had broken or falsly connected traces on the PCB.
After trying out some different terminal boards that were finally without any faults we discovered another curiosity: The Fujitsu folks have opted to create a custom ATX connector 0_o.
While a normal ATX connector has 24 connections the Fujitsu one sports only 16 pins and has a whooping six 12 V power lines instead of the usual two.
This posed quite a problem for using our NI-USB 6009 as this one could only 4 differential analogue inputs.
After trying around a bit to get a prototype with reduced functionality working we quickly succumbed to the problem that the libraries for the NI-USB 6009 were so outdated, that there was no chance to get them running on a modern Ubunut 22.04 system. Ubuntu support has only been adopted in newer NIDAQmx libraries and the older ones only support RedHat or Scientific Linux. While in the forums some support to migrate that to very old Ubuntu versions was given it was rather incomplete and we found it to be not anymore accurate.
Moving to the PicoTech PicoLog HDR ADC24
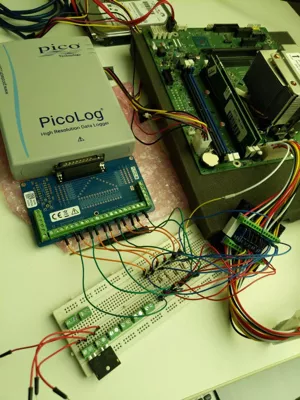
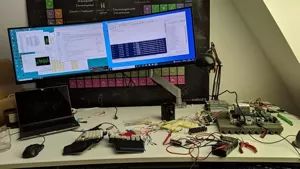
In the picture on the right you see our final system. The PicoTech PicoLog HDR ADC-24 took quite a while to arrive, because the UK is not in the EU anymore and customs seem to require some registration numbers we did never hear of so far :)
Nevertheless the system worked right out of the box.
The linux measurement client is a breeze and signals looked directly accurate with our initial prototype switchboard.
For inital testing we opted for a simple 0.5 Ohms inline shunt resistor that is measured in the differential measurement mode.
The code for importing the measurements is very simple Python. If you want to have a look at it, you can find it in our dev branch.
Judgment of the measurement quality
The results look fairly realistic compared to the RAPL measurements we are already having, but we have not done any AC falsification with the Blauer Engel team so far.
Since we are experiencing different voltages on the different 12 V lanes we suspect that either the PSU does this on purpose, or the variance between the resistors is too uneven, so the PSU balances the current output due to the varying output resistance.
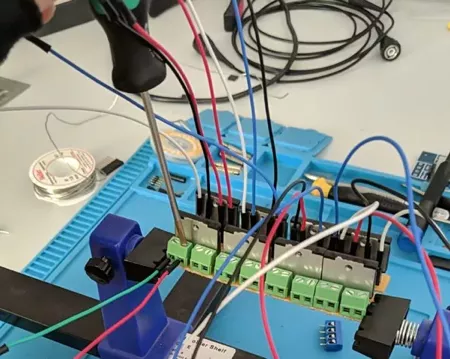
The next iteration will use special current measurement resistors and also look into reducing the measurement noise a bit by evaluating a single-ended voltage measurement where we feed the analogue ground back to the PicoLog HDR ADC-24.
Another issue we are currently having is that the timestamps of the measurement results are not synchronized with the clock of the reference system. In the current setup we have the software for the PicoLog running not on the System under Test (SUT) but on a separate machine.
The reason for that is that we initially configured our measurement setup to measure a windows machine, where our tools are not running atm. Since we are now measuring Linux only there is no reason anymore for it.
We will update the measurement setup as well as the measurements on our Metrics Dashboard. Hopefully we will also receive the new C libraries from PicoTech, as the current C libaries are broken and only the GUI is working … :(
Whats next
As soon as we have updated the measurement setup and also falsified with the Eco KDE Team and their DC measurements we will build the linear model out of it and create calibration curves for our other 4 machines we have sitting around.
Also we have ordered two Dell Power Edge Server blades to falsify our measurements with the official readings from the Spec Power Database
We hope to make the model robust enough so we can translate it to server environements in a similar fashion that is currently done for instance by David Mytton and the Cloud Carbon Footprint project. Only with a better time resolution and more accurate data.