We recently had a team of aspiring UX researches at Green Coding Solutions that made a research project on how the Green Metrics Tool can be used.
This is a guest article with their results
Team:
01 INTRO
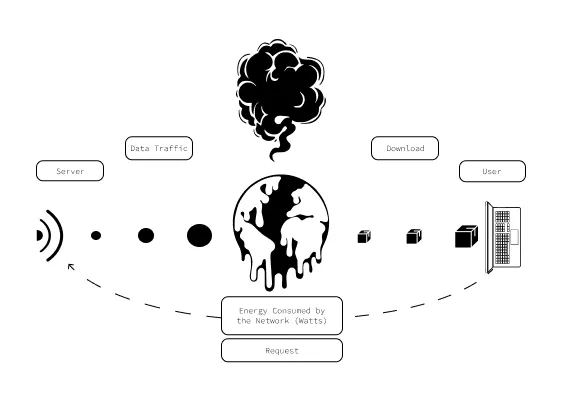
The growth in data traffic (MB) and usage of computers (%) results in global concern about its power consumption (Kwh). This can be translated into quantitative values to evaluate our Carbon Footprint (CO2 emissions) and the energy that we consume (kW). This is how we approach Green Coding and its Green Metrics Tool. With very enthusiastic research, we started to dig into the issue and try to find some solutions for sustainability and awareness by understanding the numbers and measurements in relationship with our tech behavior.
02 WHAT IS GREEN CODING?
The Green Metrics Tool is a software developed by Arne Tarara and his team of developers that measures the digital carbon footprint of web pages and software. The Green Metrics Tool is Open Source, which means that everyone can see the code of the software and get an insight into it. This tool enables the calculation of emissions and energy usage.
03 BRIEFING
We were introduced to very different (and new) topics and challenges as a starting point, to tackle them as UX/UI Design researchers. Combining the development of old and new pages inside the website, creating a valuable language, easing the usability of their tool, and understanding the user flow were some of the needs of Green Coding. Among all this, it became a challenge for us to engage in the research of a topic that came to us suddenly as surprisingly new. To encounter the world of Green Coding and to get to know their philosophy and commitment to an issue that we initially thought was completely misaligned from us. Is there a way to assume a Green Tech behavior in our daily life and our craft in the digital?
04 SURVEYS AND HOW WE TACKLED THE AUDIENCE
We needed some backup from other points of view, so we created a survey to get closer to the opinion of a diverse group of people, mostly enthusiasts, who are interested in reducing their CO2 emissions. The field of study was broad and without defining demographics.
- Would you like to reduce your carbon footprint? (Y/N/Maybe)
- How well informed are you about your carbon footprint? (Likert Scale* 1-10)
- Which methods do you use to keep control of your carbon footprint?
- If you could choose a scale or metric to alert you to your CO2 consumption, which of these alternatives is most friendly to you? (Likert Scale 1-10)
- How aware are you of the CO2 emissions that internet produces and how it might affect our planet? (Likert Scale 1-10)
- How informed are you about the negative impact of the Internet on the environment? (Likert 1-10)
- How comfortable do you feel with the CO2 emissions that produces Internet and how it might affect our planet?
- Do you have your website and/or software? (Y/N)
- Would you like to optimize your website or software so that its download and use produce less CO2 emissions? (Y/N/Maybe)
- Would you like to inform yourself regularly about the carbon footprint of your Internet Usage? (Y/N/Maybe)
- How often would you like to see a score of how much CO2 is generated by the products that you buy daily?
- Do you think that reducing your carbon footprint would have an impact on controlling global warming?
*The Likert Scale is a rating scale (from 1 to 10) used to question a person on their level of agreement (10) or disagreement (1) with a statement. It is ideal for measuring a person’s reactions, attitudes and behaviours.
04.1 SURVEYS INSIGHTS
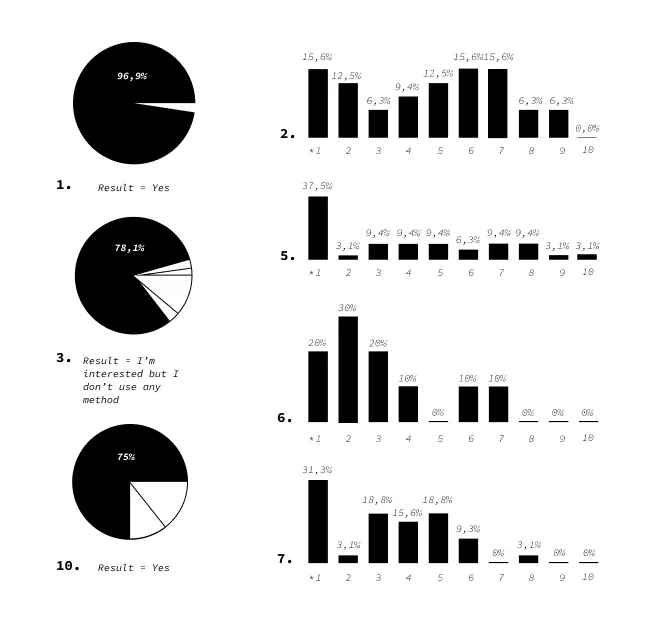
We could conclude from insights from the survey on the following numbers and assumptions:
96% of our interviewees are interested in controlling their carbon footprint but do not use any method. Users feel very uncomfortable with co2 emissions produced by the internet and software (84%). Users have a low awareness (25%) of their carbon footprint. There are no highly informed users.
The results of the survey together with our research on the subject, lead us to our problem and hypothesis statement.
05 PROBLEM STATEMENT
People need a way to become self-conscious about their CO2 emissions coming from Software and Website usage because they want to find a way to reduce their contribution to it.
06 HYPOTHESIS STATEMENT
We believe that by making people self-conscious we will achieve our goal to make the user able to use the Green Coding tools. We will know that we are right when people start using Green Metrics Tool.
07 STRATEGIES
But how do we make people self-conscious? and how do we make the user able to use the Green Metrics Tool? We define some strategies:
- By introducing educational information
- By introducing an everyday language that expresses the issue
- By creating a visual language that is coherent with our emissions
- By making instructions
- By improving the user flow
- By Improving information architecture
08 DESKTOP RESEARCH
The growing energy use of the Internet surpasses already the energy that all wind and solar power sources worldwide can provide. According to Solar Low-Tech Magazine ‘Running data centers on renewable power sources is not enough to address the growing energy use of the Internet’. Plus, ‘We were told that the Internet would ‘dematerialize’ society and decrease energy use. Contrary to this projection, it has become a large and rapidly growing consumer of energy itself.’
To align our design decisions to the issue, we decided to dig into the possibilities of reducing the sizes of websites, to generate content that would not become increasingly resource-intensive and have an efficient experience that will decrease the high demand on data traffic (Mb).
The growing importance of videos, which became a trend nowadays, makes the website excessively demanding and heavy.
09 DESIGN SOLUTIONS
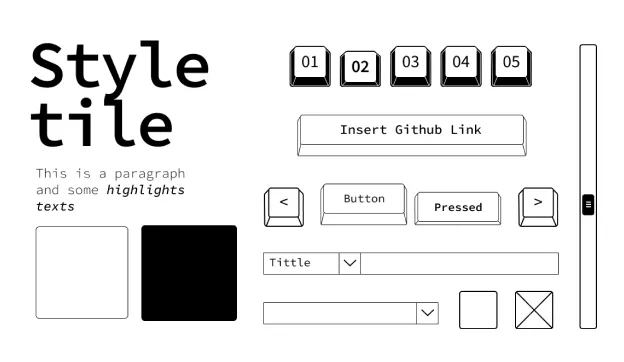
We wanted to add ethical coordinates such as accessibility, security, sustainability, and reliability; and focus on a layout based on information, readable content, but also fun and self-explaining. The organization of color and graphics becomes very important for the display of content. The amount of information must be delivered logically and predictably. Duotone, black and white contrast, and console design are chosen for usability and as a particular taxonomy that speaks about the product, and still engange a good relationship with the interface and making it functional.
 We try to reduce the cognitive load of choices, show the info I need to know first, show examples of content, organized by tasks, responsive and scalable, and with possibilities to expand the content in the future.
10 DEFINING THE USER
We defined our user persona, as a 32 years guy that is starting his career as a web developer named Joao. Joao wants to be able to reduce the damage that he does to the environment by working in tech but feels frustrated about not knowing which tools or methods are inside his range of action. He heard about Green Coding and would like to get to know about them and How it works so he can be able to use the Green Metrics Tool and support the cause.
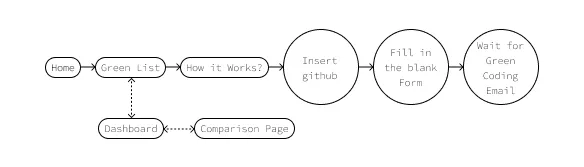
From here, Joao will approach the website by the following flow:
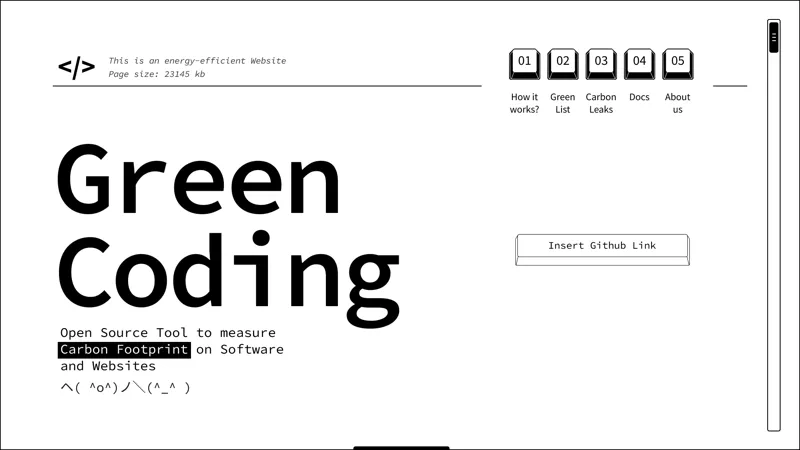
- Starting at the Homepage to get to know Green Coding and its Community and get interested in knowing about their Green List.
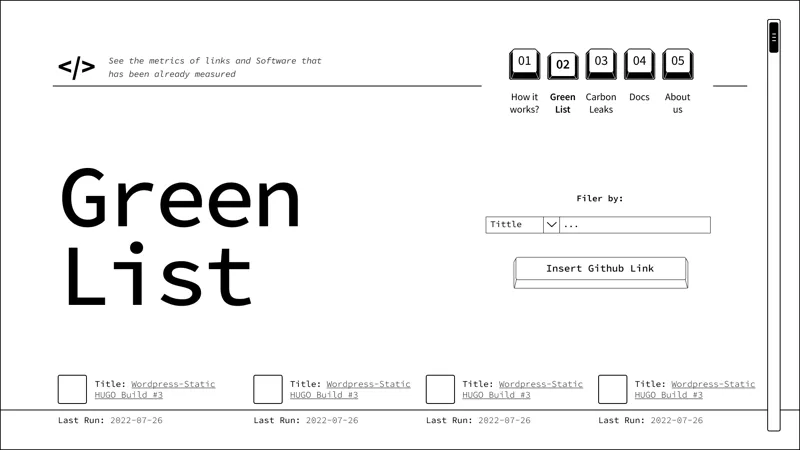
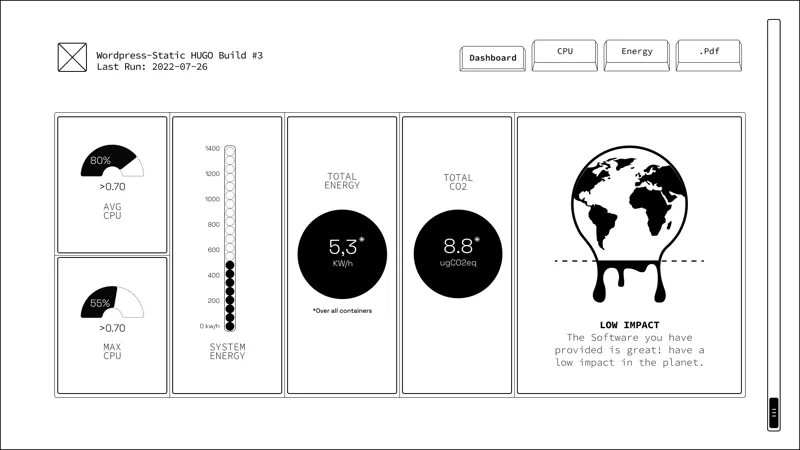
- Once at the Green List page, Joao will check the Dashboard of the Github Links that have been already provided by other users and measured by Green Coding. This will increase his interest in getting to know about other measurements such as Energy and CPU.
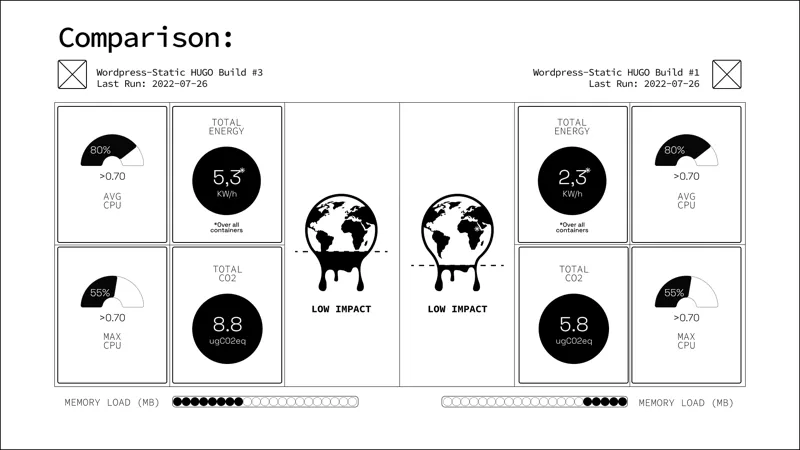
- He decides to get deeper and check on two different links to enable the Comparison page, where he can see the two links and individual measurements being compared.
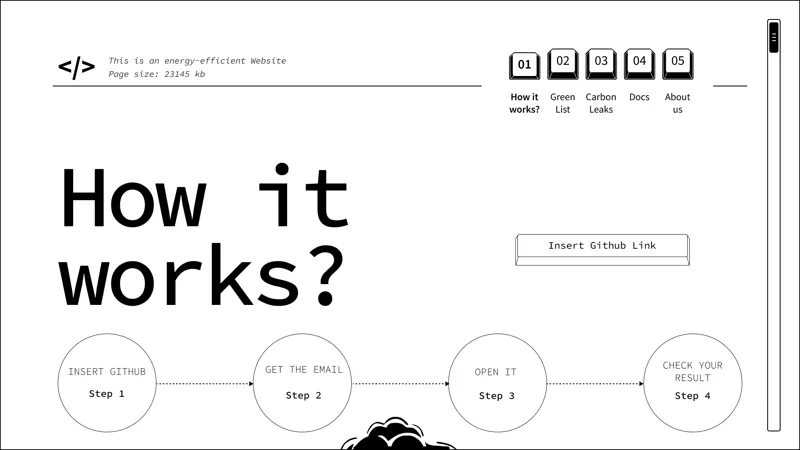
- That’s when he decided to check on How it works, to be able to participate and provide a link by himself, read some information about the functionality of the Tool, and see a global picture of the issue that is being taken on.
11 PROTOTYPE
View the MVP Prototype of the Green Coding website and follow Joao’s User Flow (not suitable for smartphones)